Reports
Overview
In the report section you are able to create different types of reports (e.g., Inventory, Data Usage, etc.). These reports uses information associated with the selected SIM Card(s) and shows in a time scale graph. With the new report created you can export the information in a CSV file, download an image or add to your Dashboard.
Create Report
To create new reports, click the Report section located in sidebar MENU. You will be redirected to the Report create page, which has a wizard form to help you create new reports. The wizard form is divided in three steps:
- Report Type – select which report type you want to view (e.g., Inventory, Data Usage, etc.);
- SIM Cards – select the SIM Card(s) to collect the data;
- Time Scale – select the time range and granularity (hourly, daily and monthly) to use in the report time axis;
Step 1 - Report Type
Select the report type that you want to view. There are currently 8 report types:
| Type | Description |
|---|---|
| Inventory | Shows you the total of SIM Cards for each SIM Card status of your inventory (or the selected SIM Card) throughout the time you selected. The status displayed are: Provisioned, Test, Pre-Active, Active, Inactive, Blocked and Retired. |
| Rate Plans | Shows you the total of SIM Cards for each Rate Plan associated to your Organization throughout the time you selected. |
| Location | Shows you the total of SIM Cards for each country visited by the SIM Cards throughout the time you selected. |
| Data | Shows you the total data usage throughout the time you selected. |
| SMS | Shows you the total SMS usage throughout the time you selected. |
| Event Rules | Shows you the total Event Rules triggered throughout the time you selected. |
| Usage Rules | Shows you the total Usage Rules triggered throughout the time you selected. |
| Notifications | Shows you the total Notification, divided by notification type (SIM Card Service, Data Service), throughout the time you selected. |
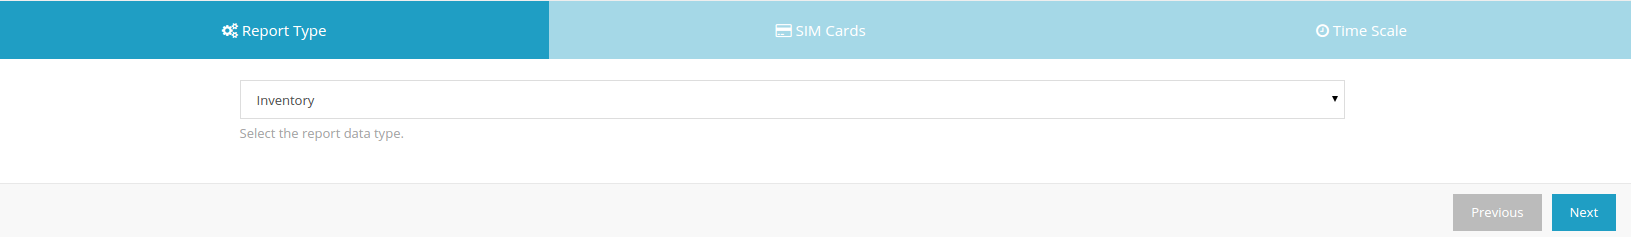
Wizard to create a report.
After adding to the Dashboard the Retired status bar will not appear.
Step 2 - SIM Cards
In this step you choose the SIM Card(s) from where you want to pull the information. There are three possible choices:
- SIM Card(s)
- Tags
- All SIM Cards
SIM Card(s)
Manually select the list of SIM Card(s) from your inventory. Use Ctrl key (or Cmd key in Mac) to select the SIM Card(s) you want to use or not.
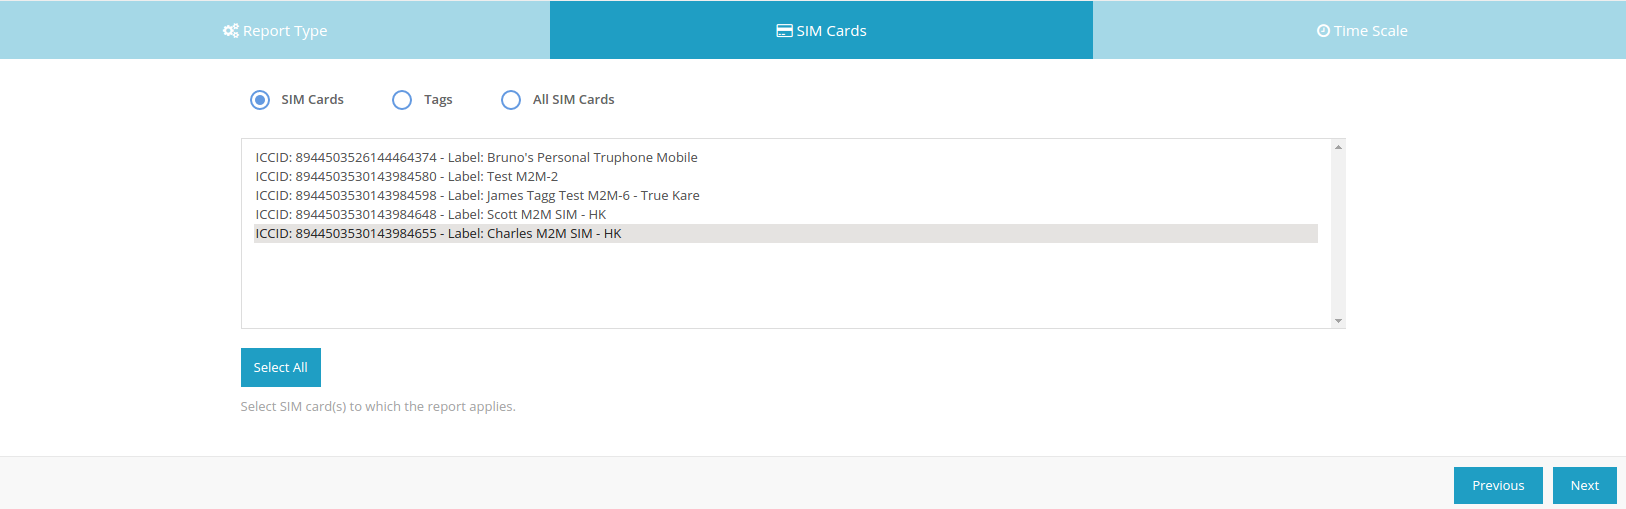
SIM Card list selection box.
If your inventory has more than 1000 SIM Card(s), this feature is disable. Apply tags to your SIM Card() and create reports with them (see below).
After adding the report to your Dashboard, the SIM Cards selected cannot be changed.
Tags
If you use the Tags option, the report will use the SIM Card(s) that have all of the Tags selected. You can create more tags using the Tags section.
Tags options selection view.
The number of SIM Card(s) in the Dashboard reports change, as you associate or dissociate Tags to the SIM Cards.
All SIM Card(s)
If you use this option, the report uses all SIM Cards in your account.
Step 3 - Time Scale
All reports have a time scale in the x-axis. In this step you have to choose the granularity to organize the data (hourly, daily, monthly or during the billing cycle) and choose the range for the time axis (selected period or a custom range).
::🚧 Depending on the granularity option selected, you can only use a maximum time range:
- Hourly granularity can only be used in a maximum of 7 days.
- Daily granularity can only be used in a maximum of 6 months.
:::
In case your account has multiple Rate Plans with different Billing Cycles. A box with the billing cycles options will show in the form. The selected billing cycle filters the SIM Card that do not correspond to it.
Selected Period
Using the selected period option, the report will always end in the current hour, day or month, depending on the granularity.
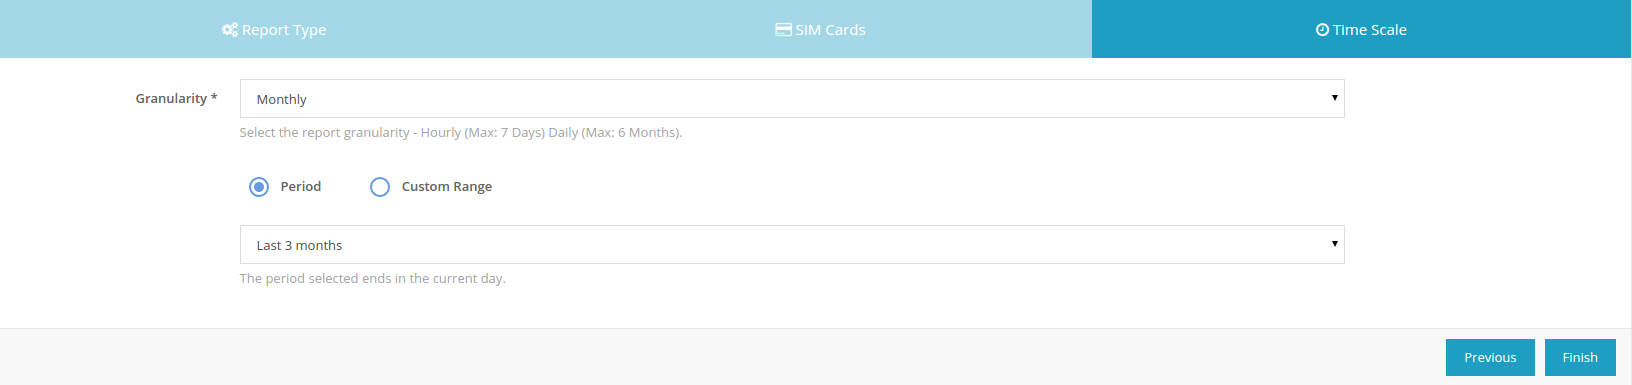
Time scale step with the period option selected.
Currently there are 6 options:
- Last 7 days
- Last 14 days
- Last 30 days
- Last 3 months
- Last 6 months
- Last year
Custom Range
In case you select a custom period, you need to choose the two dates (start and end) to create the report.
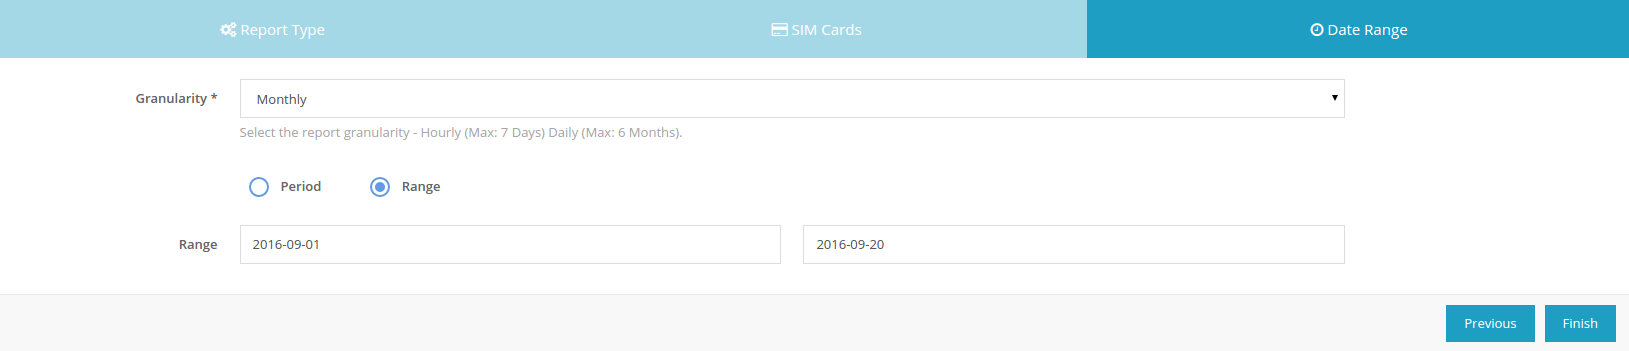
Time scale step with the custom range option selected.
:::Caution
Some errors might appear if you select:
- Start date or end date in the future.
- Start date after end date.
:::
View Report
After the options are selected, you will be redirected to the report view. Here, you can change some attributes that were previously selected (e.g. tags, granularity, etc.), export the data in a CSV file, download an image of the report generated and add the report to your Dashboard.
Report view after successfully completing the wizard form.
:::Caution To generate the report you will always need to have all attributes selected. :::
:::Caution The same errors as the report create form, might appear. :::
Graphs - Features
The generated graph always shows tooltips with detailed information for each point or bar; Graphs with multiple bars, have the options to show or hide each bar; Usage graphs have a line for the average usage per SIM Cards;
Actions
Export
If the report is generated, you are able to download a CSV file with the content used to generate it. Some reports do not have a CSV actions (e.g. Inventory report).
To export the information you can click “Export” and choose the method to export the information, see Report Export for more information.
Download Image
If the report is generated, you can download a image of the report generated.
Add to Dashboard
If the report is generated, you can add to your Dashboard with a label attached to it.
:::Caution When adding the new reports, your Dashboard settings will reset. :::
Examples
This section shows some examples using the report section.
Example 1
| Report Type | SIM Cards | Granularity | Custom Range |
|---|---|---|---|
| Inventory | IM Cards (Selected 3) | Monthly | 1 Jan. 2016 - 31 Aug. 2016 |
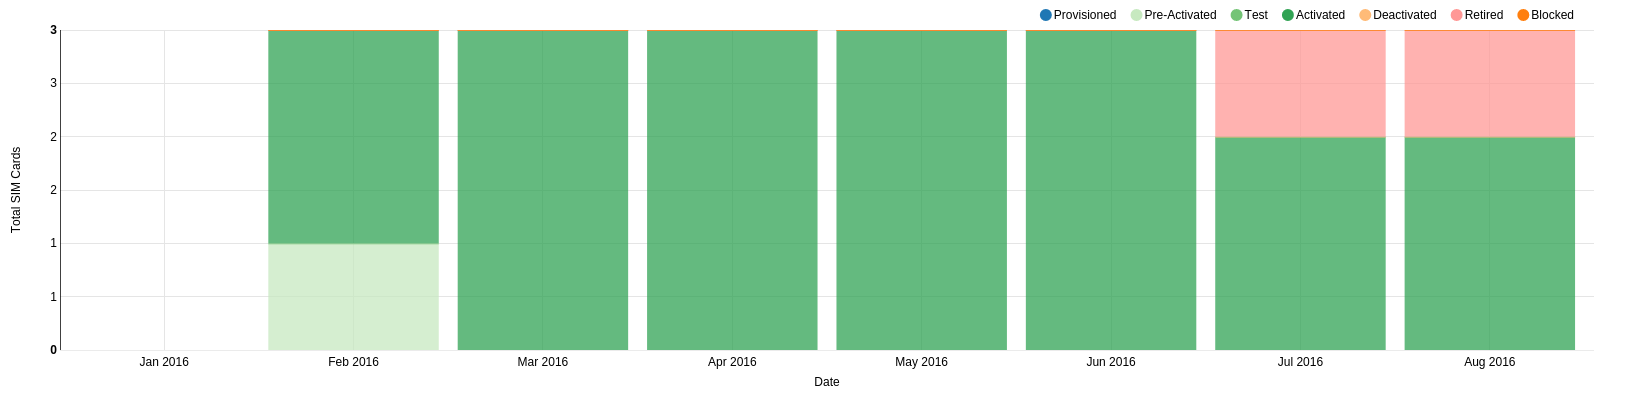
Example 1 generated graph.
Example 2
| Report Type | SIM Cards | Granularity | Custom Range |
|---|---|---|---|
| Data Usage | All SIM Cards | Hourly | 12 Sep. 2016 - 14 Sep. 2016 |
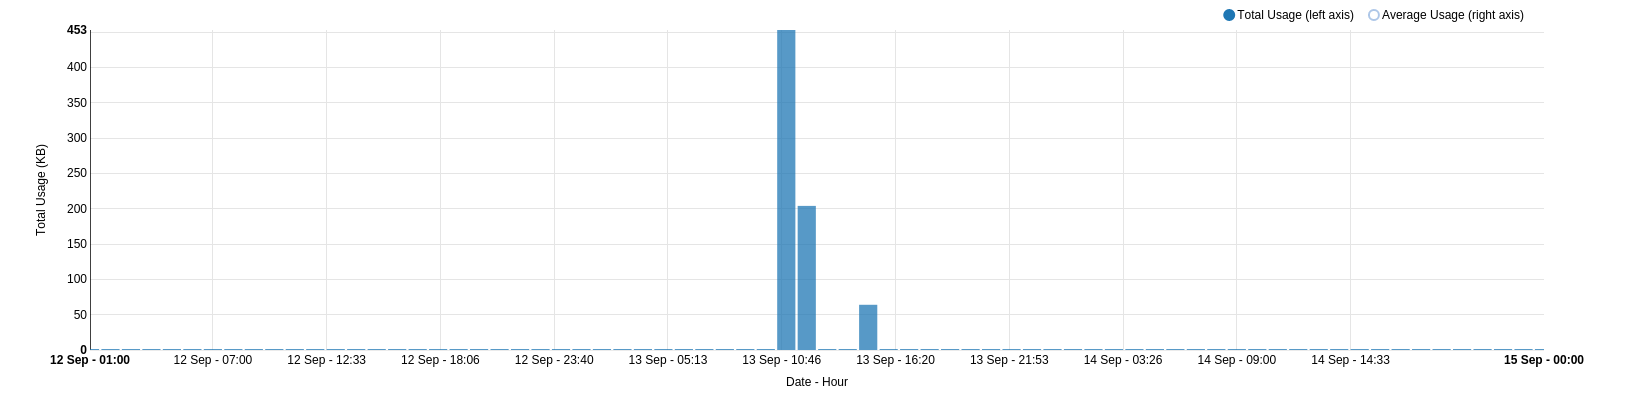
Example 2 generated graph.
Example 3
| Report Type | SIM Cards | Granularity | Period |
|---|---|---|---|
| Event Rules | Using 2 Tags | Monthly | Last 6 Months |
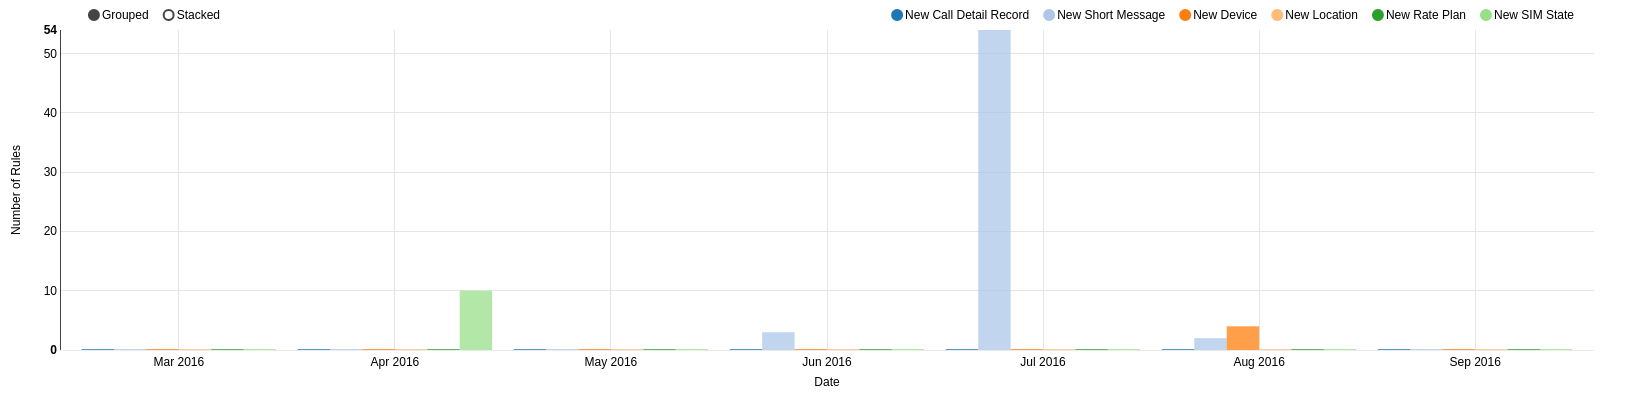
Example 3 generated graph.